Abstract
This paper describes the editor of street graphs,
which is a part of system for a traffic simulation – Java Urban Traffic
Simulator (JUTS). It enables the users to create a street graph from the given
geographical data, or to modify it. The street graph is a detailed road map of
a town district, it includes roads, crossroads, vehicle or parking lanes. Street
graphs are intended to be used as an environment for a traffic simulation in
Pilsen (Czech Republic), or in any other town which can provide the whole
simulation system with all input data in the correct format.
All actions of the editor can be done in
an elegant way, users do not need to be specialists in geographical systems. The users can create a new map or they can change an
existing map saved in XML format.
Keywords: road
map, map-editing, XML, GIS systems, simulation system, 2D system, JUTS.
1 Introduction
In Pilsen, as well as in most cities and bigger towns,
there is a very bad traffic situation both in the historical center with a
great number of narrow lanes, and on the main roads with the heavy traffic. As
in Pilsen there is no simulation system that works on the microscopic level (it
means a simulation of particular vehicles), we were asked to create a
simulation system that would enable a traffic simulation based on the real
data measured directly inside the roads, and that could be extended in the
future.
In this project we cooperate with the
transport department of Pilsen municipals from which we obtain the data for the
half-automatic simulation map generating and the data for running the
simulating process coming from several detectors. For software preparation and
testing we use the data from one small district of Pilsen.
We are trying to create a complex
simulation system with easy methods for editing and generating simulation maps
and other modules for data preprocessing. The main aim of this project is to
simulate the traffic concentration depending on real data measured on the real
roads and at crossroads. Basic parts of our system are a simulation core [1]
and a graphical user interface that communicate together and perform the
simulation with an online visualisation. The system also includes a map
editor and transformation utilities for data conversions. The Map editor serves
for an easy and comfortable preparation and editing the maps (= street
graphs).
This paper shows how a traffic
simulation can be graphically supported by creating a special tool – the
graphical editor. Also a close relationship to data files and their formats is described.
Section
2 goes into the related work, existing GIS system and systems for traffic
simulation. The structure of the system into more detail decribed in Section 3,
file format specifications in Section 4. More information about the graphical editor and some
of its most important functions can be found in Section 5. Section 6 concludes
the paper.
2 Related Work
A traffic simulation system can be a very useful tool
while anticipating traffic jams, possible problems during road reconstructions,
etc. The transport department of Pilsen municipals is using just a sketch tool
for global traffic flow calculations based on some public and commercial area
positions together with a raw traffic network structure. As no microscopic
simulation is available, Pilsen is interested in creation of a microscopic
simulation model of the traffic flow and in getting more information about
traffic in more specific areas.
As we want to have a detailed model and a manual map creation takes a long time, we
need some graphical tool for a semi-automatical map creation. At first, we were
trying to find some suitable existing system that we would be able to use for
the preparation of street graphs. That is why we were exploring GIS systems.
According to [2], there are over 20
companies (e.g. Bentley, Intergraph, ESRI, Foresta, Gepro, ...)
dealing with GIS. The number of products themselves is even higher. Most of
them put stress on a coordinate system exactness, a work with rasters and many
other geodetic and construction functions which are important for the map
creation. At a user’s disposal there are many
functions for various distances, surfaces or land tract computations. Software
packages differ in size of the areas they are working with – some are good for
processing the whole states, some are suitable for covering coordinations of
building estates, roads or stands only.
The basic functions of GIS systems are
usually very similar, the systems differ in specialized functions. Due to the
requirements for a close cooperation with other parts of the simulation system,
requirements for specialized functions e.g. for crossroads editing. Since it is
necessary to have a simple and cheap tool, we decided to find a system
most conformable to that we would need, and to create a new specialized graphical
tool for the simulation map creating and editing – a graphical street graph
editor. After consultations with experts from the Department of Mathematics – the
Department of Geomatics, University of West Bohemia, we decided to use the
system Kokeš [3].
The basic study was to get a maximum
amount of information concerning the service and style of work in the systems
for map processing. We tried to find such functions which would simplify and
speed up editing of street graphs to the user.
A graphical editor of street graphs has
to combine some control elements used in usual graphical editors and some
special functions for manipulation with the map and its parts – crossroads,
roads, etc.
3 The JUTS project
At the beginning of
the JUTS project, there was only a case study for a new microscopic model.
But during the time, as the cooperation with the Pilsen city has been growing,
it has become a project with many subproblems, subprograms and team members.
The main part of the project is the simulation module that loads the map and
performs the simulation and enables visualisation of the simulation. Input data
for the simulation are prepared in the separate part of the system.
Map data
(geographical coordinates and information about crossroads) are loaded by
the map editor. In the editor, data are processed into the form of a map
and saved in the XML files.
Values
of the traffic intensity are measured by detectors – measuring loops – which
are placed under the surface of each crossroads lane. These detectors are
counting numbers of cars that drive over, and every 15 minutes they save the
measured values in the form of a separate file to the central computer. We
can operate with these files. At present, we can apply data from the whole year
2004. Measured values are preprocessed in the separate system part and read in
the simulation part of the system, where the real traffic is simulated.
The
process of simulation can be followed online (it means the user can see how
cars were driving in the observed district) or offline (the user is interested
just in some critical sections of the traffic during the day and in the final
statistics; the visualisation is not used). A more detailed description of JUTS
system you can find in [4]. The structure of the system is shown in Figure 1, the whole project is written in Java.
The graphical editor
serves for comfortable preparation of the simulation system input data, but
they can be also prepared by a direct modification of the XML files. It uses
known techniques but because of being so specialized, it cannot be produced by any
other tool.
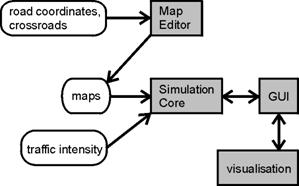
Figure 1: Structure of
the JUTS system.
4 File Formats
Input and output files have a specific format. This
format was one of the basic things we had to standardize at the beginning of
the work because there are several parts of the system that use these files. Except
for two input files with the geographical data, files are given in an XML
format. The XML format is very advantageous for many reasons (well
prepared methods for XML processing in Java, universality of this format and
its simplicity).
There are five files with which the
editor works – two input files with measured geographical data (coordinates of
road segments and crossroads points), an input file with crossroads description,
an output file with the graphical part of the street graph data which is used
by the simulator for a map visualisation and a simulation output file with
relationships of roads, crossroads, etc.
4.1 Input File – Road
Segments
This file has not an XML structure. It is a text file
containing geographical data – vertex coordinates of all road segments. Each
line contains coordinates of a bounding box of one road segment. All
coordinates are measured with respect to the official geographical measured
point which is located near the town of Talin (the starting point of the S-JTSK
– the system of the unified Czech/Slovak Trigonometric Cadastral Net [5]).
These values do not give the exact
direction of the road segment. They just say that the segment is closed inside
of the bounding box and it starts and ends on the border of the bounding box.
4.2 Input File – Crossroads
Points
It is another text file. It gives all coordinates of
crossroads points of the processed region. A crossroads point can be a
crossroads or just a point where “something happens“ (e.g., an exit from a
parking place, or just a connection of two road segments). Each road segment
goes from one crossroads point to another.
Measured values are, as in the first
input file, given with respect to Talin.
From these two input data files, a basic
road net can be automatically prepared. For each road segment bounding box, two
crossroads points are found and a road segment is determined as the segment of
a line between these two points. Although we use this approximation, it gives
good results for the simulation. Examples of possible situations during
connecting crossroads points and road segment bounding boxes are shown in
Figure 2. An example of a final road net is shown in Figure 3.
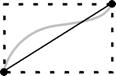
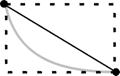
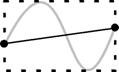
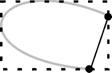


Figure 3: An example of a
road net.
4.3 Input File - Crossroads
The file has an XML format and includes data from the
traffic light controlled crossroads. A crossroads is described from two points-of-view,
a static view and a dynamic one. The static view describes the crossroads from
the view of a designer (a total number of streets, their names, a total number
of vehicle lanes and their directions, etc.). The other view represents the
data from measuring loops detecting cars driving over detectors and formulas
for calculation of the traffic intensity. This part of file is not important to
the graphical editor.
Each crossroads has its name and number.
These attributes are gained from the official city infobase. If we look at the
crossroads from the designers point-of-view, we can see that each crossroads
has several streets, with a defined name and a rough orientation. The orientation
of every street is specified according to the clock time (see Figure 4). In
this point, an accuracy of the rough orientation is adequate. The more accurate orientation setting comes
during the map editing while mapping the crossroads onto the crossroads point.
Each street consists of two parts – a
road going to the crossroads (roadIn) an a road which goes from the crossroads (roadOut), roads are divided into vehicle lanes (laneIn, laneOut). For a vehicle lane there are several attributes – a
description and a shortcut of the direction of the cars and also a vehicle lane
sequence considered from the left side of the road (in Figure 5 marked with
numbers). Some other mentioned features of the crossroads description can be seen
in Figure 5. The file format thinks also of more specialized cases, such as
one-way roads, roundabouts, flyovers or more complicated crossroads.
All crossroads parts have their own
identifiers which serve as a connection with the simulation system.

Figure 4: A rough orientation according to the
clock time used for the street description.
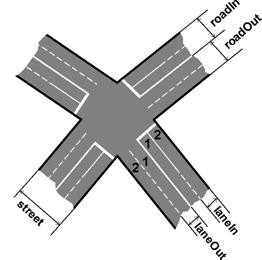
Figure 5: A description of the basic crossroads
parts and their relation to the XML tags.
The editor generates two output files.
The first one, a graphical part of the map, serves for an online
visualisation of results. The other one, a simulation part of the map, is used to
save the map structure for the simulation. These two files are generated so
that it would be possible to separate the simulation and visualisation part. It
is not necessary to do the visualisation each time (or the whole time), as well
as the simulation (results obtained from the simulation can be “replayed“). It
would be possible to keep both kinds of information in one file, but it is more
useful for us to have it in two files, e.g., the XML parser for both files can
be done in a more simple way. All elements in both files have their
identificators which serve for connecting separate map parts.
4.4 Output File – the Graphical Part of the Map
Graphical part of the map serves for
an online visualisation of results. Any time during the map creation and
modification it is possible to export it into the output XML file. It means
that each operation has been finished and the map is consistent after each
operation.
The structure of this
XML file can be seen in the form of a tree structure in Figure 6. All data are
encapsulated in the tag graphic. It includes a bounding rectangle (BoundingBox), a part for roads (RoadGraphic) and a part for crossroads (CrossRoadGraphic). RoadGraphic may contain one or
more description of particular roads (RoadGraphicItem), CrossRoadGraphic may contain one
or more crossroads definition (CrossGraphicItem). Each road is determined by its id
(roadID) and consists of one or several
vehicle lanes (lane), which is described by two curves,
see Figure 7. Each crossroads has also its unique id (crossID) and is given by
several curves, see Figure 8. Crossroads places for definition of possible car
driving directions are defined here (CrossRoadPlace), too.
... ...
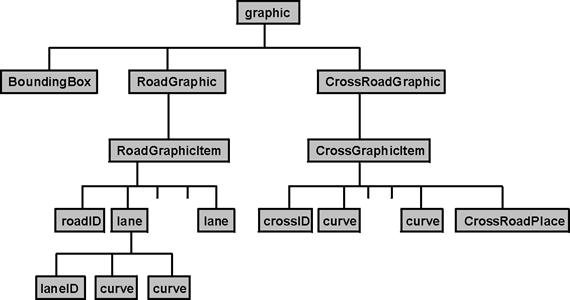
Figure 6: The
structure of the output XML file with the graphical part of the map.
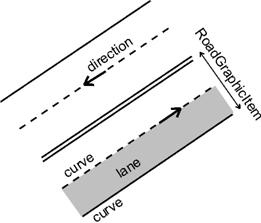
Figure 7: A visual illustration of dividing the
road into the XML tags.
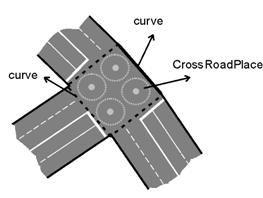
Figure 8: A visual illustration of dividing the crossroads into
the XML tags.
Items are further split
into more detail parts, but this extended description is not necessary on this
level of understanding.
Each item (vehicle
lane, road, crossroads) has its own identifier. This ID is used for the connection
of graphical and simulation files. The simulation file is briefly mentioned in the
next part.
4.5 Output File – the Simulation Part of the Map
This type of the output file serves for a traffic
simulation. It includes connections between all items of the map. The roads are
connected to the crossroads, the crossroads carry a definition how cars can drive through, etc. This file also
contains generators and terminators that provide the car traffic simulation. These
objects are constructed in the simulation model and are of no interest in the
graphical editor and out of scope of this paper.
5 Editor
The graphical editor enables an easy construction of both
the output files from the given input data. Both the output files can be
reopened and the graphical and simulation part modified.
After
reading input data files the editor uses all data to make a maximum of
work automatically, then the user can complete the map by adding information
about vehicle lanes, one-way roads, etc. The finished map can be also modified,
single map parts can be inserted, deleted, modified or completed.
The work runs in several steps:
1) From the input geographical data (the input file with road
segments and crossroads points – Sections 2.1, 2.2) a basic road net is
automatically generated – the neighbouring road segments and crossroads points
are connected, possible positions of crossroads are determined.
2) The user can change the generated road net by
creating/deleting of the crossroads points or road segments. Several functions
for the road net modification are available. The user has to allocate particular
crossroads from the list to the prepared crossroads positions. The crossroads
are described in the other input file (Crossroads - Section 2.3).
3) According to the placed crossroads, the roads for
necessary vehicle lane number are automatically extended. Neighbouring
crossroads are connected.
4) The user corrects vehicle lane numbers - e.g., he/she can add vehicle lanes for
turning to the right or left.
5) The editor automatically preprocesses possible
directions and ways for driving through the crossroads. The user can correct or
complete it manually.
6) The user can add parking lanes if necessary.
7) The created street graph can be exported into both the
output files – the graphical and the simulation part (described in Sections 2.4
and 2.5).
The graphical user interface of the
editor uses many controll elements to simplify creating the street graph –
menu, toolbars with easy access to most frequently used functions. Each
component can be hidden or set visible. Part of the main editor window with
menu and all visible toolbars can be seen in Figure 9.
Figure
9: Part of the main editor window with menu and all visible toolbars.
As it was mentioned in the introduction
section, the graphical editor of street graphs has to combine some control
elements of usual graphical editors and some special functions for manipulation
with the map and its parts – crossroads, roads, vehicle lanes, access places,
etc. The functions can be divided into several groups, the most important are:
functions for file processing, view functions and design and map functions.
5.1 Functions for File Processing
The user has two possibilities how to start working
with the map. The first one is to create a new street graph from all input
files. As there is more than one file read into the editor and data have to be
read at the same time, the editor uses a project file. This project file (in the
XML format) includes references to all necessary inputs. Functions for project
creation and modification belong to the editor file functions, too.
The other possible way is a modification
of complete street graphs (graphical and simulation one) which are already
saved in the correct XML format. Any map like this can be opened, changed and resaved.
For reading and storing data in the computer
memory we use a DOM (Document Object Model) approach which is fully supported by
classes from the Java Core API. The DOM classes create a tree object model in
the memory which can be easily modified. Data from this tree are after each
operation directly exportable to the output XML files.
5.2 View Functions
These functions are intended for working with the map
view – map scale, zoom, a region choice by a rectangle, exact map scale settings,
etc. It is possible to say that the editor covers all expected (normally used)
functions for this group of editors.
The editor also enables switching to a
full screen mode. In this mode all controll elements are hidden.
5.3 Design and Map Functions
These functions are the key part of the editor. They
are the main reason why this special type of graphical editor has been
constructed. The functions are used for the design, corrections and removal of
lines, roads and crossroads. The editor also enables several user interface
settings for more comfortable work.
Map elements functions belong to
fundamental ones. The user can insert a new map element – road, vehicle lane,
crossroads, ... directly into the street graph. During creation, basic
properties (size, position) have to be set. The rest of the element properties
can be set in the time of creation or later. For this modification the
element can be chosen from the street graph directly by a mouse click or
through the dialog with a list of all existing map elements. It is also
possible to work with a group of elements. The algorithms for element choice
can be found in [6].
The system also enables automatical
corrections (a connection of adjacent elements or fastening a newly
created road to the existing crossroads, etc.).
The editor supports work in layers – it
means that every element is placed in one of several specialized layers –
roads, crossroads, text descriptions, etc. All layers can be set visible or
some of them can be hidden. In the user interface setting each layer obtains
its own color and the style in which it is drawn. All pre-set values can be
saved to an INI file (also in an XML format).
If the user likes to use, e.g., an aerial photograph of the constructed area,
he can insert the picture on the background of the street graph, create the map
and then remove the picture or use another one.
An example of the application state during
the street graph processing can be seen in Figure 10. It is a situation after the
first step – reading the input data. Crossroads points and road segments are
processed.
Figure
10: The main application window after reading of the input data.
6 Conclusion, Future Work
This paper presented a system dealing with the street
graphs (maps) processing. The main functions and main features necessary for
the style of work in the graphical editor are described. This system allows the
user to create a completely new street graph from the input data files or to
open and modify an already existing map. In the paper, the used file formats were
described in detail.
The editor as well as the other parts of
the simulation system have been implemented in Java. Thanks to classes for XML
processing this file format is very suitable for data manipulation in the
intended task.
The next step in the developement of the
software will be a testing phase by responsible experts from the municipal
traffic department. It is possible that the range of the input files will be
extended in order to handle other future tasks by the intended users. This
depends on possible requirements of responsible experts. We hope that the whole
simulation system will help to improve the traffic situation in Pilsen.
Acknowledgements
I would like to thank to Dr. Ivana Kolingerová and Dr. Pavel
Herout from the Department of Computer Science and Engineering, Faculty of
Applied Sciences of the University of West Bohemia, Pilsen, Czech Republic for
their suggestions and advising during preparing this paper.
The research was supported by a grant of
the Grant Agency of the Czech Republic – Research of methods and tools for
verification of embedded computer systems, no 102/03/0672. Moreover, my work
was fully supported by a special scholarship from the Pilsen municipals.
References
[1] Hartman,
David, Head Leading Algorithm for Urban Traffic
Model. Proceeding of European Simulation Symposium. pp. 297-302, 2004
[2] Cajthaml,
Jiří, The present state of geographic
information systems for towns and cities in Czech Republic. Proceedings of GIS
Ostrava 2005
[3] GEPRO
s.r.o., Documentation for Interactive Graphical
System. 2002
[4] Hartman,
David, Implementation of Head Leading
Atgorithm in Simulation of Traffic in Pilsen. Eighth United Kingdom
Simulation Society Conference, Oxford, UK, 2005
[5] Veverka,
Bohuslav, Krovak Projection.
http://krovak.webpark.cz/e_version/krovak.pdf
[6] O' Rourke,
Joseph, Computational Geometry in C.
Cambridge University Press, 2000