1. Abstract
This paper provides a short insight in a project carried out at the Institute of Computer Graphics at the University of Technology in Vienna. The purpose of this project was to visualize dynamical systems in a 3D augmented environment providing interactive manipulation facilities.
2. Introduction
The project goal was to build a flexible, bidirectional communication system between AVS and the Studierstube. The system should allow the examination of scientific data created by AVS in the augmented reality environment of the Studierstube, using the manipulation devices and display possibilities provided there.
To achieve the project goals we decided to implement a client/server application, which should behave similar to the X-Server concept as used on UNIX-Systems. The Server is implemented in C/C++ using the OpenInventor Class Library providing easy access to 3D graphics, the Simple Sockets Library which simplifies the development of a TCP/IP communication using sockets, and the Fastrak Library for evaluating the input devices of the Studierstube. It is responsible for handling the input devices, rendering the scene and dispatching events to the appropriate client. The client application tells the server what has to be displayed and is responsible for handling events.
The AVS side of the project was supervised by DI Helwig Löffelmann and implemented by Andreas H. König, the VR side was planned and supervised by DI Anton L. Fuhrmann, the protocol design and implementation was done by Markus Krutz and Andreas Zajic.
3. The Studierstube
The Studierstube (german term for "study room") is a project to visualize three-dimensional data and allow multiple users to examine and manipulate this data simultaneously using VR devices. The Studierstube consists of a real room with real objects and virtual objects that can only be seen while looking through the HMDs. The person wearing the HMD can see through the glasses, watching an overlay of the computer generated objects over the real environment. Every user can individually look at and walk around/through the projected augmented objects seeing them correctly displayed regarding his position and line of sight. So the Studierstube can also be used as an collaborative educational setting to explain scientific data.
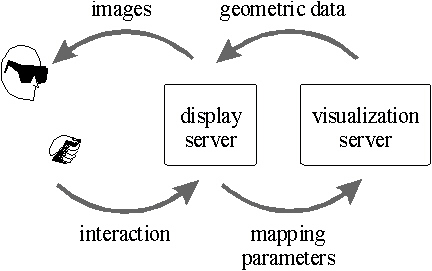
To realize this project we decoupled the rendering process and the calculation of data being visualized similar to the concept of X-Windows (see figure 1).
Figure 1. decoupled simulation model
The Hardware of the Studierstube includes a Standard LINUX PC running a tracker server software to control the tracker hardware that keeps track of two Virtual I-O i-glasses, a 3D-mouse, and the Personal Interaction Panel (PIP [Szal97]).
The PIP is a two handed interaction device that consists of a flat rectangular panel and a pen. Both the panel and the pen are tracked in position and orientation. At this time the PIP is used to position and rotate objects, which are virtually attached to its surface. Since the user is holding the PIP in one of his hands, he always knows the current position of both the PIP and the virtual object. Future applications of the PIP include special objects connected to its surface, which can be used to control parameters of the displayed scene. These controls could be manipulated in a desktop-like manner and resemble current desktop items (button, sliders ...). To use such controls it is absolutely necessary for the user to have knowledge of their exact position and the PIP provides this information as feedback, otherwise it would be difficult to manipulate them in three-dimensional space. Further details about possible applications concerning the PIP can be found in [Szal97].
The display server runs on a SGI Indigo 2 workstation with Maximum Impact Graphics communicating over a network with the visualization server running on a SGI Power Challenge.
4. Tools
The whole application is written in C/C++. To ease the software development, we used several libraries. For the display server, we used OpenInventor - a flexible 3D class library - for rendering. The input devices are accessed using the Fastrak library, written by A. Fuhrmann. The whole communication is done by using the Simple Sockets Library, which makes communication via sockets really easy. The client side was developed by A. Koenig using AVS, DynSys3D and Geom2SerIV.
Now, let’s have a brief look at some of these tools:
4.1. Inventor
OpenInventor is an object-oriented 3D-toolkit. It is a library of objects and methods used to create interactive 3D-graphics applications. It contains a set of building blocks that enables the application developer to write programs that take advantage of powerful graphics hardware features with minimal programming effort. Based on OpenGL, the toolkit provides a library of objects which can be used, modified, and extended to meet new needs. Inventor objects include database primitives, including shape, property, group, and engine objects; interactive manipulators, such as the handle box and trackball; and components, such as the material editor, directional light editor, and examiner viewer.
Inventor offers the economy and efficiency of a complete object-oriented system. In addition to simplifying application development, Inventor facilitates moving data between applications with its 3D interchange file format.
Inventor focuses on creating 3D-objects. All information about these objects - their shape, size, coloring, surface texture, location in 3D-space - is stored in a scene database. A node is the basic building block used to create three-dimensional scene databases in Inventor. Each node holds a piece of information, such as a surface material, shape description, geometric transformation, light, or camera. All 3D-shapes, attributes, cameras, and light sources present in a scene are represented as nodes. An ordered collection of nodes is referred to as a scene graph. OpenInventor takes care of storing and managing one or more scene graphs in the database. On such a scene graph you can apply a number of operations or actions, including rendering, picking, searching, computing a bounding box, and writing to a file. When an action is applied to a node, the graph rooted by that node is traversed from left to right. [Ment]
4.2. Simple Sockets Library
The communication between the display server and a corresponding client program is realized via a TCP/IP-Connection using sockets. To simplify the access to the sockets, we made use of the Simple Sockets Library(SSL).
The SSL written by Charles E.Campbell, Jr., Ph.D. and Terry McRoberts provides the C/C++-programmer with a set of functions that allow to set up communication over sockets in a quick and easy way. Most of the SSL’s functions resemble C’s file i/o functions (printf, scanf ...). When using the SSL a specific program, that allows clients to connect to servers using any available ports – the portmaster –, must be started on the machines running the display server and the visualization server. Servers register themselves with a name to the portmaster running on the same machine. Then the clients can access the server they want to communicate with by opening a connection using the server’s name, without knowing the specific port number.
4.3. Advanced Visualization System (AVS)
The AVS-system allows users to interactively connect software modules to create data flow networks for scientific visualization.
AVS consists of two major parts: the main application, which includes the AVS-Kernel, and AVS-modules, which are computational units that can be linked together into flow networks. Modules tell the AVS Kernel what kind of data they expect to receive from other modules at their input ports and what kind of data they supply at their output ports. These output ports can be connected to other modules that have compatible input ports.
Because AVS operates on fairly general data types, you can define new modules to work with existing modules. Application developers can concentrate on algorithms that implement new functionality by building on capabilities that already exist.
[AVS92]
4.4. DynSys3D
DynSys3D is a multi-purpose workbench based on AVS for the rapid development of advanced visualization techniques [Löff97a, Löff97b] in the field of three-dimensional dynamical systems, designed to support incremental and parallel implementations of new ideas in this field.
All modules of DynSys3D produce standard AVS output, which was important for the integration of DynSys3D and the Studierstube. To export the geometry to the display server a simple conversion utility that converts AVS-geometry into the Studierstube’s format (OpenInventor) was used.
5. Conceptual and implementation details
The "Studierstube" consists of two servers, the display server and the visualization server, which are connected via a TCP/IP-connection using sockets. Below we give a short description on how we designed and implemented the display server.
5.1. The Display Server
The display server performs four major tasks (see figure 2):
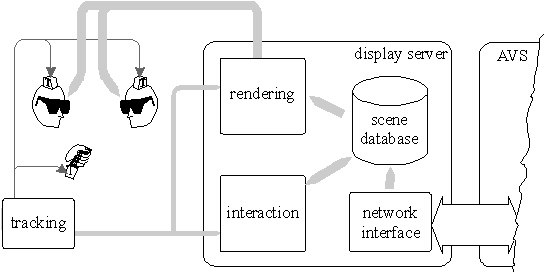
Figure 2: Display server and hardware configuration
5.1.1. Rendering
Depending on the current position and orientation of the HMDs the scene is rendered. In addition to the geometric application data, a cursor and input feedback objects are rendered. The rendered scene is displayed in a window (render area) which gets redirected to the HMDs.
5.1.2. Interaction Devices
The interaction devices supported at the time are the 3D mouse and the PIP, which both allow interactive manipulation of the scene. The mouse is represented as an arrow-shaped cursor, which can be moved around and rotated in all directions.
An object can be moved and rotated by pressing the appropriate button. Depending on which button is pressed, the rotation center is either the object origin or the cursor hot spot. The first kind of rotation has proved to be useful, if the user is standing near the object, the second one is useful for orienting objects at a distance. Rotation and movement are done locally on the display server, without communication to the client.
For interaction with the AVS-client on the visualization server the user can draw a line or set a point, which generates an event, that is sent to the visualization server.
For example, if you visualize a dynamical system like a lorenz attractor, you can initiate a new stream surface by dragging a line and a new stream line by setting a point. Then, an event will be dispatched to the visualization server, which uses the events to calculate the new stream line or stream surface and sends the new geometry back after the calculation is done. A "wait cursor" is displayed until the new object comes in.
To get immediate visual feedback for these interactions, the line and the point are rendered. As long as the user is dragging a line, a "rubberband" line is rendered, which is connecting the first set point of the line and the cursor hotspot. These feedback functions are provided locally at the display server.
5.1.3. Managing the scene database
The display server uses inventor database functions to store the current geometry in the scene graph. It gets inserted into the whole scene graph at a predefined location and is replaced whenever a new object is received from the visualization server.
The input feedback objects are temporarily added to the scene database. Once a point has been set or a line has been drawn, the point or line is inserted into the scene graph. While a line is dragged, the "rubberband" line is constantly updated.
5.1.4. Network Interface
Both servers, the display and the visualization server provide a network interface. The display server acts as the server and the visualization server is the client of a TCP/IP-connection.
A message based protocol has been designed to meet our requirements. There are three kinds of messages:
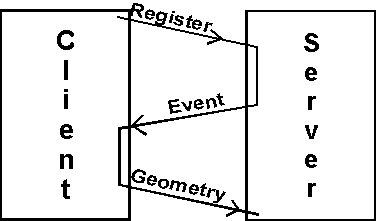
Figure 3: Message flow model
Each application running on the visualization server has to register its interest in specific events at the display server, e.g. "I’m interested in a point event from the left button of the 3D mouse". Each registry entry is assigned a unique identifier, which allows the client to easily determine which module is to receive a specific event.
Event messages contain these events. They contain an identifier and event specific data, e.g. "left button pressed on 3D mouse at location x/y/z".
Geometry messages contain geometric data generated by the visualization server, which are encoded similar to the Inventor File Format. These messages then are converted into an Inventor subgraph at the display server.
5.2. The Visualization Server
The visualization server consists of three major parts (see figure 4):
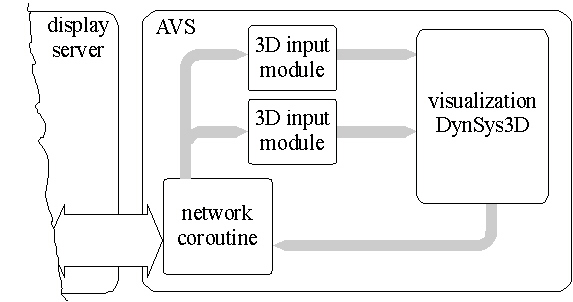
Figure 4: AVS/DynSys3D configuration
5.2.1. Network Interface
The network interface module is responsible for the communication with the display server. Because this requires permanent execution of the module and standard AVS subroutine modules are only invoked when their inputs or parameters change, it had to be implemented as an AVS coroutine module. This kind of module executes independently and can always obtain inputs from AVS and sending outputs to AVS.
This module performs two tasks: It receives the events from the display server and passes them on to the 3D-input modules. From the DynSys3D modules it receives new geometric data, which is processed and converted into a binary protocol format and then sent to the display server.
5.2.2. 3D Input Modules
3D input modules are used to integrate the various kinds of event-specific data into the data flow concept of AVS in an appropriate manner. AVS uses different data ports for different kinds of data, like geoms, floats or integers. The network coroutine can’t have output ports of all possible data types. Therefore, 3D input modules are required, which input the required data types into the AVS network. Converting the arbitrary data they get from the network coroutine, they are able to produce output, that fit into AVS’s data flow model.
5.2.3. Visualization Modules
Visualization modules are receiving data from 3D input modules and sending geometry to the network interface. Based on the 3D input and their parametrization they (re-)calculate the dynamical system and pass the new geometry to the network coroutine.
6. Example
Let’s have a brief look at the following example network, which visualizes an RTorus dynamical system. RTorus is a ‘synthetic’ dynamical system which is very useful for demonstrating certain properties that are common to lots of others.
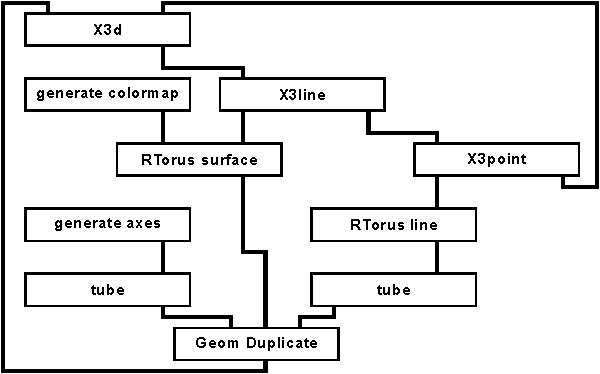
Figure 5: Sample AVS network
The network shown in figure 5 contains two 3D input modules (X3line, X3point), which must be registered to the display server in order to be notified, when the appropriate event occurs (line drag, set point).
For example, when the user drags a line (plates 1 to 3), the display server sends a line drag event to the visualization server. The visualization server’s network coroutine (X3d) forwards the event to both 3D input modules. Because each event is provided with an unique identifier, X3point knows that this event is addressed to it. Then, X3point converts the event data into AVS-compatible data type and puts the result on its output port. Based on this data, Rtorus Surface recalculates the stream surface and passes it over to the network coroutine, which sends the new geometry back to the display server. The display server then updates its scene database and renders the new scene (plate 3).
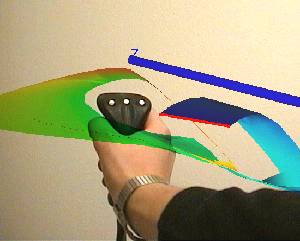
plate 1: button down - injecting a new streamsurface
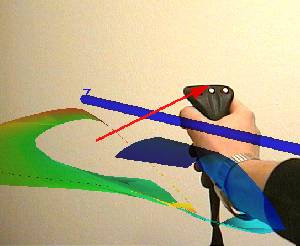
plate 2: drawing the seedline (note red "rubberband")
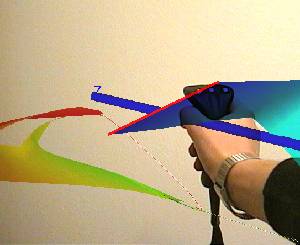
plate 3: button release - geometry updated
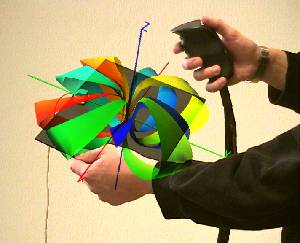
plate 4: investigating Rtorus on PIP (two-handed interaction)
7. Future Work
Right now the following topics are planned to be included in the Studierstube project in the future:
8. Summary
By connecting the augmented reality system Studierstube and the visualization system DynSys3D a synergistic effect started: Researchers who investigate dynamical systems profit from the intuitive interaction techniques available for 3D space in the Studierstube, and also from the collaborative setting. From an augmented reality researcher’s perspective, the behavior and demands of "real" users (the designers of dynamical systems) supported the development of the Studierstube as a practical tool, and also permitted us to verify that useful work can be done in such a setup.
9. References
[AVS92] AVS Developers Guide - Release 4. Advanced Visualisation Systems Inc, 1992.
[Löff97a] H. Löffelmann, L. Mroz, E. Gröller: Hierarchical Streamarrows for the Visualization of Dynamical Systems. To appear in: Proc. of the 8th Eurographics Workshop on Vis. in Sci. Computing, April 1997
[Löff97b] H. Löffelmann, E. Gröller: Visualizing Poincaré Maps together with the underlying flow. ftp:// ftp.cg.tuwien.ac.at/pub/TR/97/TR-186-2-97-06Paper.ps.gz
[Ment] J. Wernecke: The Inventor Mentor: programming Object-Oriented 3D graphics with Open Inventor, Addison Wesley, 1994.
[Szal97] Zs. Szalavári, M. Gervautz: The Personal Interaction Panel - A Two-handed Interface for Augmented Reality. To appear in: Proc. EUROGRAPHICS’97, Budapest, Hungary, 1997.